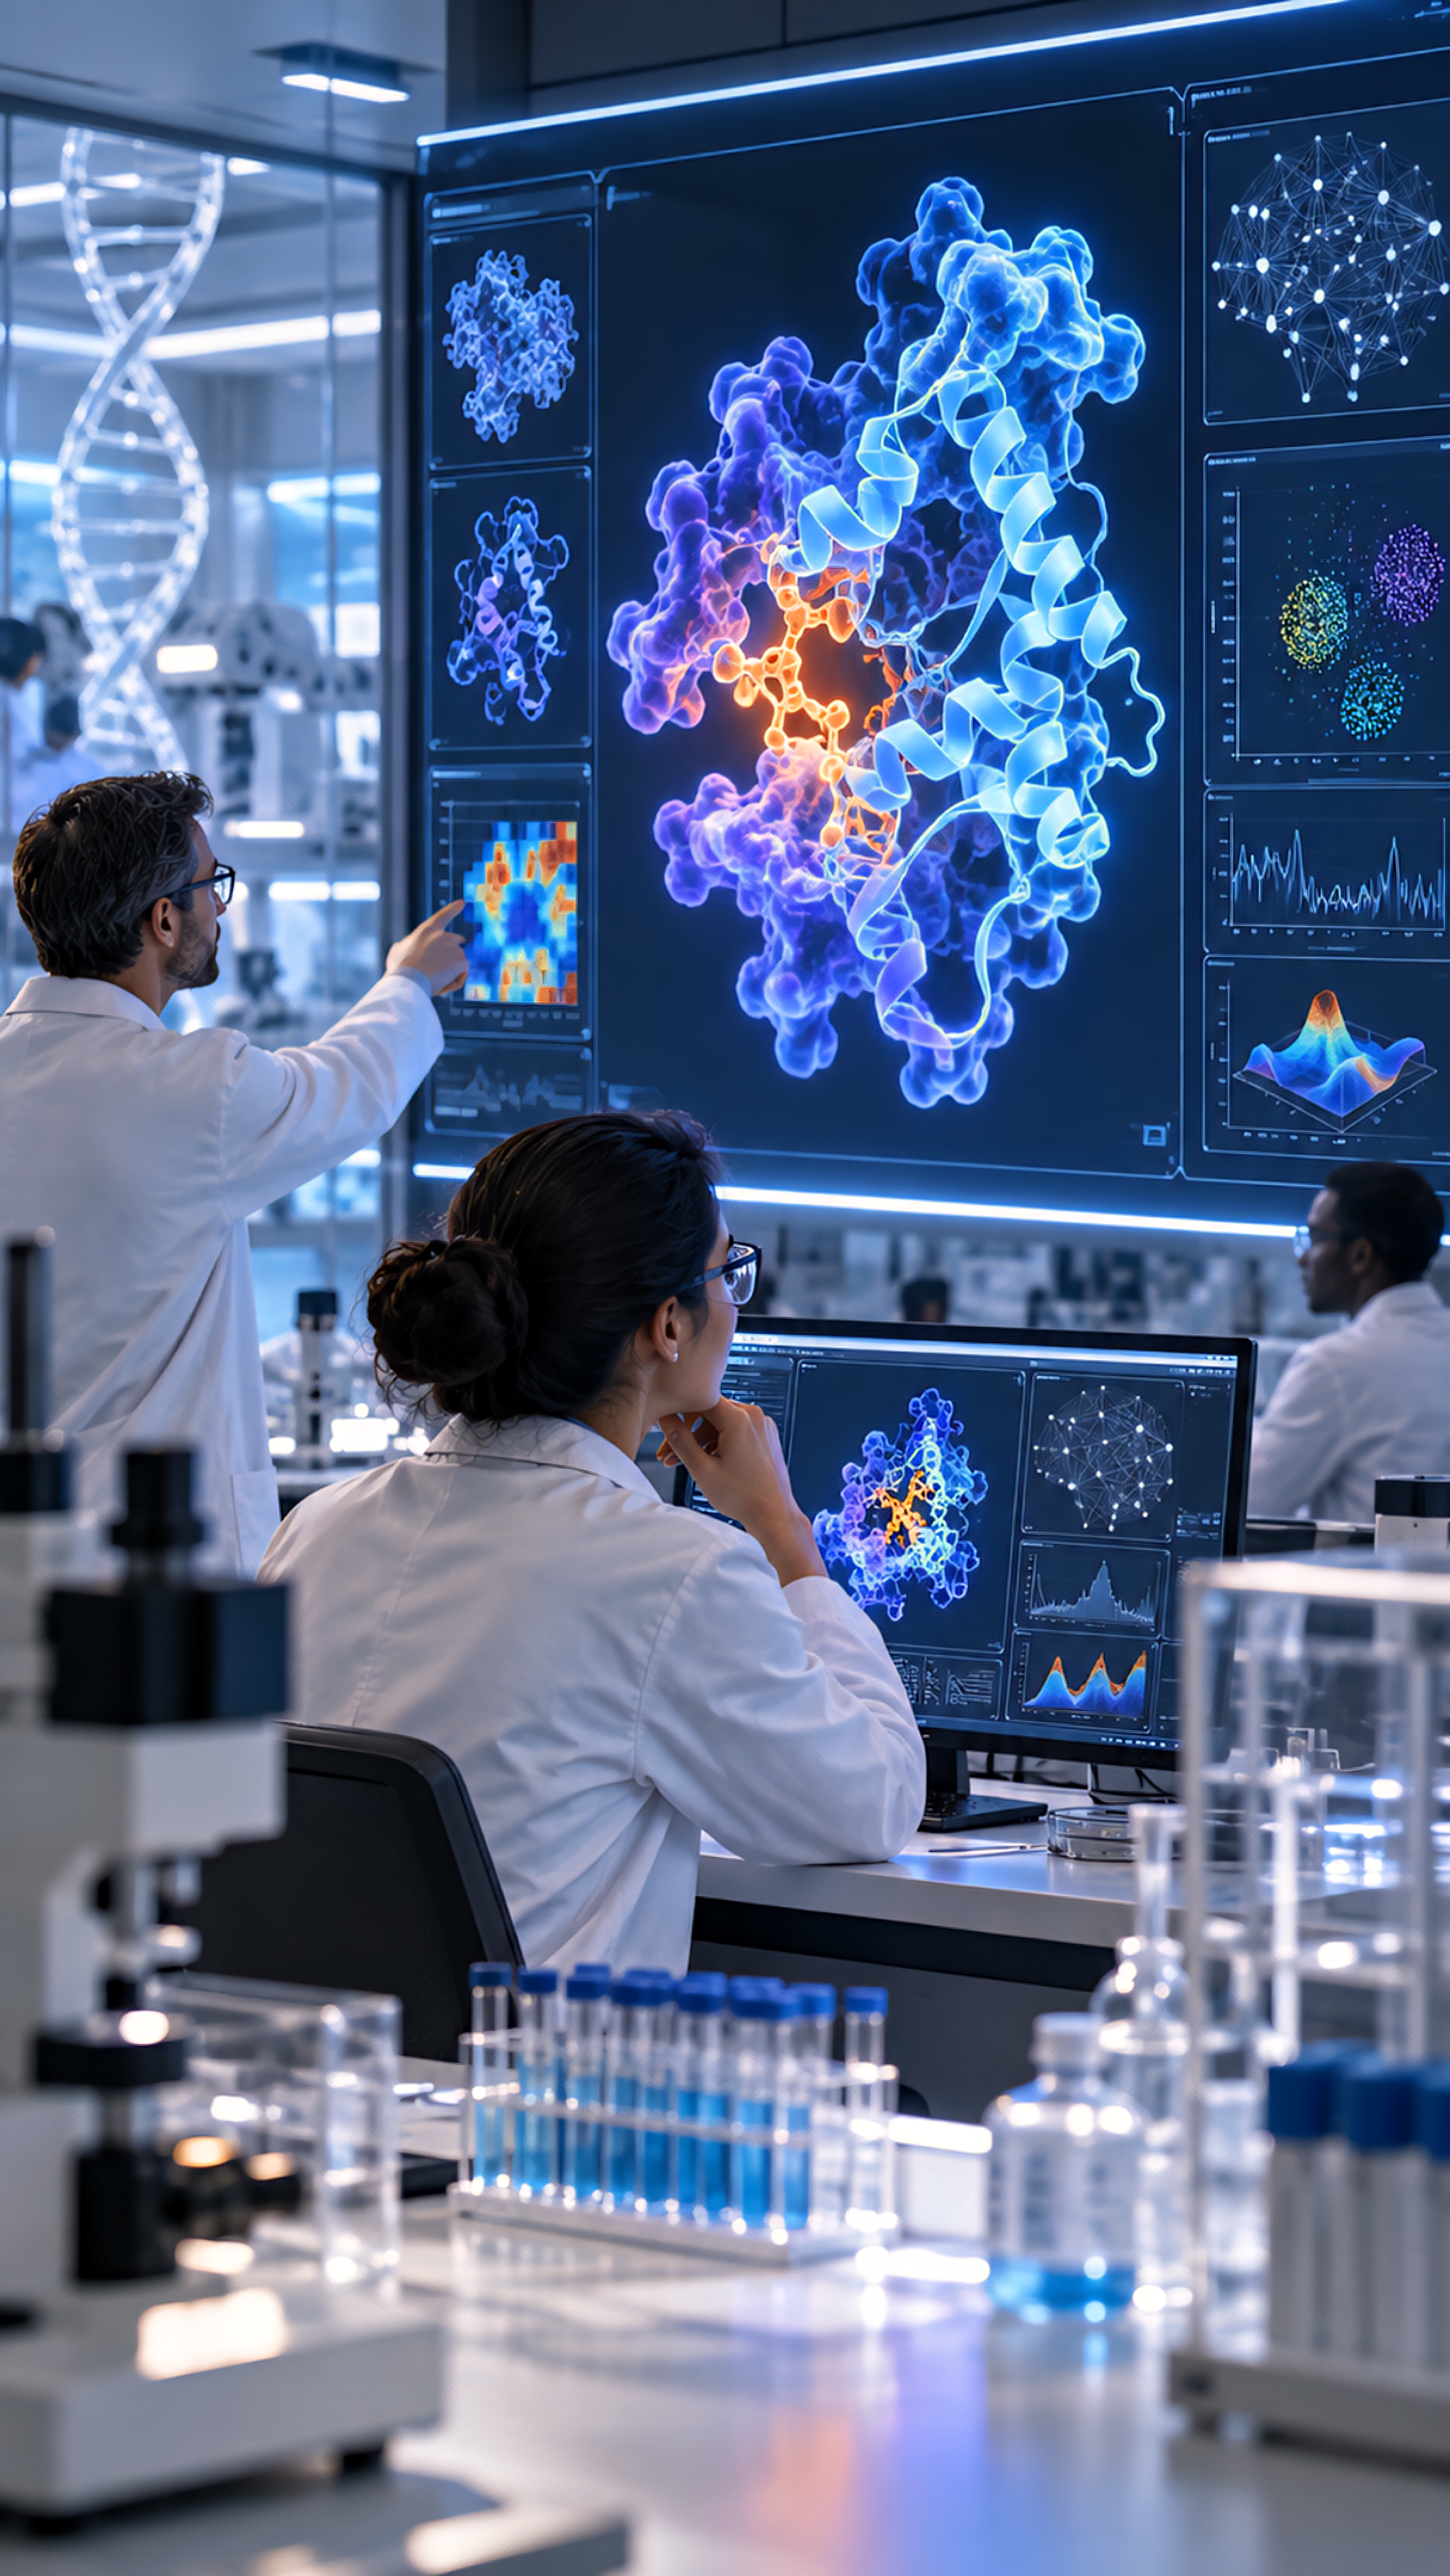
A colourful brain map can make the result of AI research look immediate: an image becomes a network, and the network seems ready to explain behaviour. FlyWire’s fruit-fly connectome is more interesting when the work between those stages remains visible.
Its story brings together microscopy, automated reconstruction, collaborative correction and scientific interpretation. For creators explaining AI research, and business owners assessing systems that turn images into structured information, it offers a concrete example of why the intermediate work deserves attention.
What the 2024 paper delivered
Sven Dorkenwald and colleagues’ Neuronal wiring diagram of an adult brain, published in Nature on 2 October 2024, presents a reconstruction from an adult female Drosophila melanogaster. The resource contains 139,255 reconstructed neurons and chemical synaptic connectivity, with data available for download and interactive browsing.
The paper also states important limits: electrical synapses are outside this connectome, observed synapse counts underrepresent the actual number, and some connections involving few synapses remain undetected. Those qualifications belong beside the achievement when describing what the resource contains.
This article revisits that published work rather than announcing a new 2026 brain-mapping result. The useful question is how to understand the evidence behind the map and the kinds of investigation it makes possible.
The AI contribution has a specific place
The FlyWire project’s account describes an adult fly brain imaged with electron microscopy. AI and other algorithms aligned and segmented the resulting images, producing a preliminary connectome. Scientists and citizen scientists then proofread it using the collaborative platform.
That sequence gives “AI helped map the brain” a more precise meaning. The automated work contributed to turning image data into a reconstruction that could be examined and corrected. A summary should preserve the distinction between the acquired images, the preliminary reconstruction and the reviewed resource.
For a general reader, segmentation can be approached as a question about which parts of an image volume belong together. The scientific significance depends on what those reconstructed objects represent and how their relationships are established. An attractive rendering is a way to inspect or communicate the result; it is not the full account of how the result was obtained.
Proofreading was infrastructure, not an afterthought
The earlier FlyWire methods paper, published online on 23 December 2021 in Nature Methods and appearing in its January 2022 issue, describes browser-based collaborative editing of three-dimensional segmentations. Its edit history is programmatically accessible, including for uses such as estimating proofreading accuracy.
The authors also describe an open community organised around sharing reconstructions with attribution. This supplies a useful example of a research resource whose collaborative structure is part of its method, rather than merely a communication channel attached at the end.
The editorial implication is to give correction a verb and an object. Who examined which reconstruction? What could they edit? What record remained? “Humans were involved” leaves those questions unanswered. A description of the actual review process lets readers understand the contribution more clearly.
This does not establish that any large group can validate any scientific dataset. The lesson for another project is to ask what expertise, tools and review arrangements the task requires. Borrowing the word “community” does not reproduce the conditions of FlyWire’s collaboration.
Keep a wiring claim distinct from an activity claim
A structural connection and a record of activity answer different questions. Reading this resource as a reconstruction from microscopy means treating its connections as anatomical evidence. A claim about what happened during a particular behaviour would need evidence addressing that event and its timing.
That distinction is an interpretation of the measurement method, not a claim that structure is unhelpful for function. In the 2024 paper, the authors trace pathways from a subset of photoreceptors towards descending motor pathways to illustrate how structure can suggest candidate mechanisms for sensorimotor behaviour.
For an explainer, retain the level of that claim. A pathway can guide a focused question about a possible mechanism. Describing the map as a direct recording of an animal’s moment-by-moment experience would add a different kind of result.
When reading a follow-up study, ask what additional evidence it brings: a model with stated assumptions, an observation of activity or a behavioural experiment. Evaluate the claim against that study’s own methods instead of transferring certainty from the visual richness of the original map.
A route-map analogy helps, within limits
Imagine a fictional transport diagram showing a connected route from one station to another. The diagram makes the route available for inspection. It does not say that a passenger travelled it at ten o’clock, how crowded the train was or why someone chose the journey.
The analogy is deliberately limited. Neurons are not train stations, and a transport map is not a biological model. It simply separates a structural relationship from an observation of a particular event. Use it to clarify the question, then return to the actual neuroscience.
For a creator writing a caption, the practical move is to identify what the picture encodes. If colours distinguish reconstructed objects, explain that convention. If a highlighted route is selected for illustration, say so. Do not allow a display choice to become an unstated scientific conclusion.
Ask about the errors that affect your question
The published limitations make the review more specific. If a proposed claim depends on a small connection being absent, ask how the reconstruction’s stated coverage affects that inference. If the question concerns a type of connection excluded from the resource, acknowledge that scope before interpreting the map.
These are proposed reading questions, not a reanalysis of FlyWire. No connectome data were downloaded or tested for this article. A specialist investigation would need to identify the relevant release, methods and quality evidence for its particular analysis.
There is a related issue in MaryChuks.com’s guide to image segmentation and object counting: the meaning assigned to an outline determines what the resulting structured data can answer. In a connectome, keep the reconstructed object and the biological interpretation equally visible.
Give an AI research story a clear evidence trail
- Identify the specimen and the data acquisition method.
- Explain what automated processing produced.
- Describe the correction process and the record of changes.
- State which connections and limitations the resource includes.
- Separate structural findings from any further functional claim.
FlyWire is a substantial example of AI-assisted science because the reconstruction, review and interpretation can be discussed as distinct contributions. Following that evidence trail makes the achievement easier to appreciate—and gives readers better questions to ask of the next impressive map.
Sources
- Dorkenwald et al.: Neuronal wiring diagram of an adult brain — Nature, 2 October 2024.
- Dorkenwald et al.: FlyWire: online community for whole-brain connectomics — online 23 December 2021; issue January 2022.
- FlyWire: About the project — undated project page.
Sources checked on 5 November 2026. The transport example and proposed reading questions are illustrative; no reconstruction, behavioural experiment or data reproduction was performed.
Discover more from Marychuks.com AI, Psychology, Business & CreativeVerse
Subscribe to get the latest posts sent to your email.